Trump Claims S&P 500 Soared 30% Under His Watch
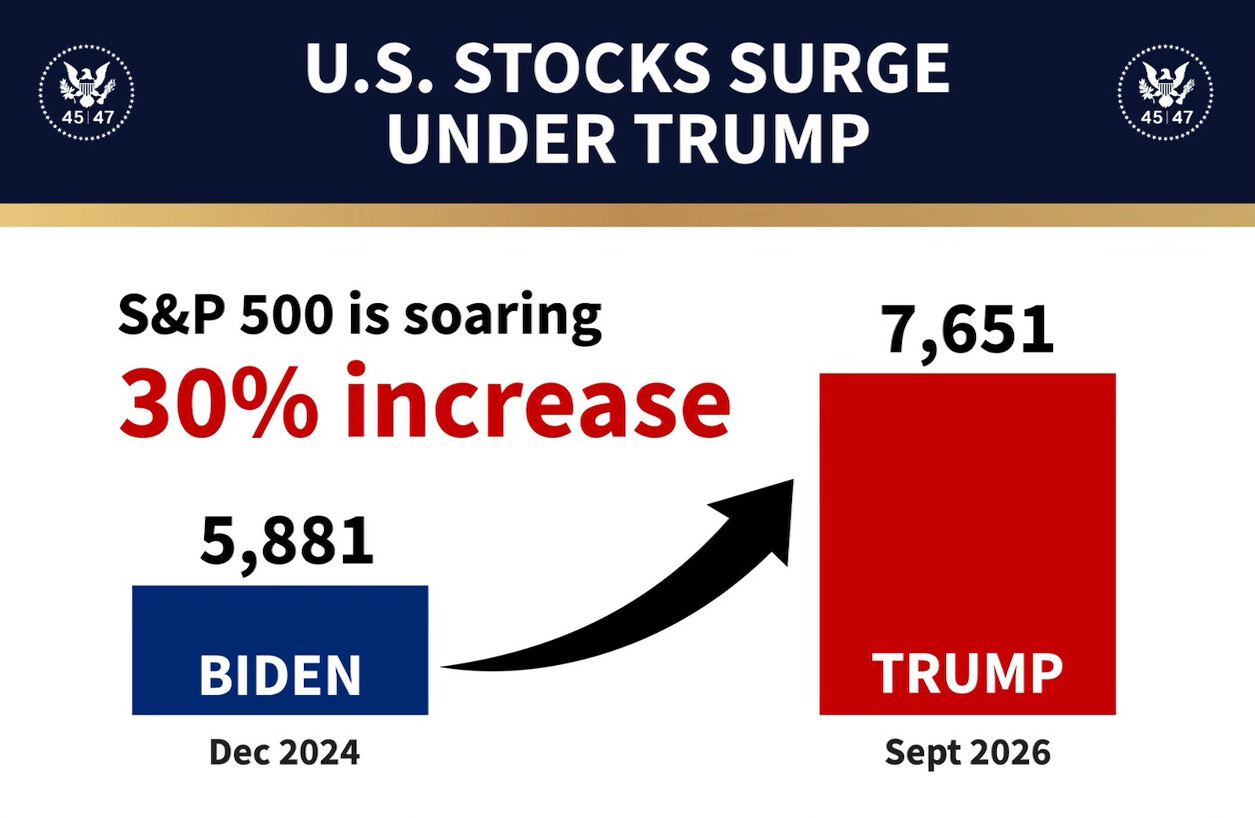
Trump posts graphic comparing the S&P 500 at 5,881 in December 2024 to 7,651 in September 2026, claiming a 30% increase he attributes to his presidency.

WASHINGTON D.C. — Donald J. Trump posted a promotional graphic claiming the S&P 500 surged 30% since he took office, attributing the stock market’s rise to his administration.
The graphic displayed a bar chart comparing two data points. It showed an S&P 500 level of 5,881 labeled “Biden” and dated December 2024, alongside a level of 7,651 labeled “Trump” and dated September 2026. A large upward arrow connected the two bars beneath the headline “U.S. Stocks Surge Under Trump.” Presidential seals bearing the numbers “45” and “47” flanked the image, referencing Trump’s non-consecutive terms.
Here is the full post on truthsocial: “U.S. STOCKS SURGE UNDER TRUMP S&P 500 is soaring 30% increase BIDEN Dec 2024 TRUMP Sept 2026” on October 20, 2026 at 8:51 AM ET.
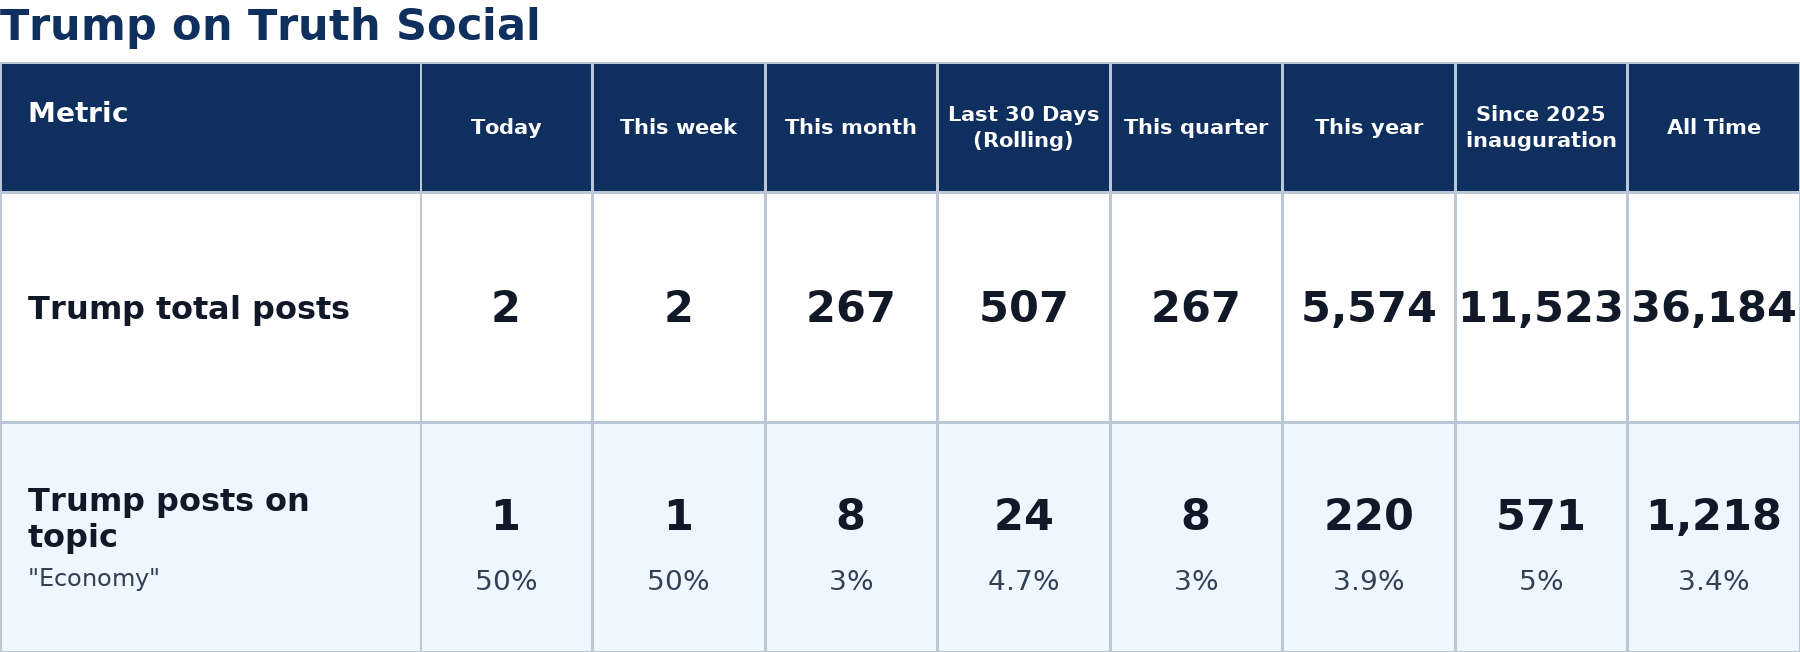
This is Trump’s 2nd message released today, and the last post was 7 hours ago, and it is not part of a thread. On average, Trump produces 18 posts per day since his inauguration on January 20, 2025. The move fits a broader pattern in Trump’s recent messaging, with 24 of his 507 posts over the last 30 days classified as Economy posts.
The graphic selects its starting and ending dates to frame the comparison favorably. Trump’s claim uses December 2024 as the baseline, a month when Biden still occupied the White House before the January 2025 inauguration. The choice of September 2026 as the endpoint captures a market high without accounting for any intervening volatility.
Stock market performance depends on many variables beyond presidential policy. Federal Reserve interest-rate decisions, corporate earnings cycles, global trade conditions, and consumer spending trends all shape index levels. A single comparison between two data points on two dates does not establish causation.
The S&P 500, a benchmark index tracking 500 of the largest publicly traded companies in the United States, serves as a widely followed gauge of market health. Gains in the index benefit Americans who hold retirement accounts, pension funds, and brokerage portfolios tied to broad market performance. A sustained rally affects a majority of the population’s net worth.
Trump has frequently used truthsocial to highlight economic indicators he considers favorable. The 30% figure cited in the graphic represents a raw price return. It does not appear to account for dividends reinvested, which would alter the total return calculation. The graphic also omits any comparison to the S&P 500’s performance during Biden’s full four-year term, which began in January 2021 when the index stood well below the December 2024 level cited in the post.
No independent source in the available record confirms or disputes the specific 7,651 figure attributed to September 2026. The 5,881 figure for December 2024 aligns roughly with publicly available closing levels for the S&P 500 during that month. Daily fluctuations mean the precise level depends on which trading session is selected.

Zenger analysis
Photo by Zenger analysis
President Trump is the author of The Art of the Deal, Think Like a Billionaire, and Think Big. Analyst and Trump supporter Rod Martin points to The Art of the Deal, Trump's 1987 book, as an explanation of his deal-making philosophy: making big announcements, pivoting often in public statements and, Martin says, ultimately getting what he wanted all along. Critics contend that Trump's books were published decades ago or were aimed at making money, not shedding light. "Generally," Martin said, "critics don't read The Art of the Deal. If they did, they would understand."