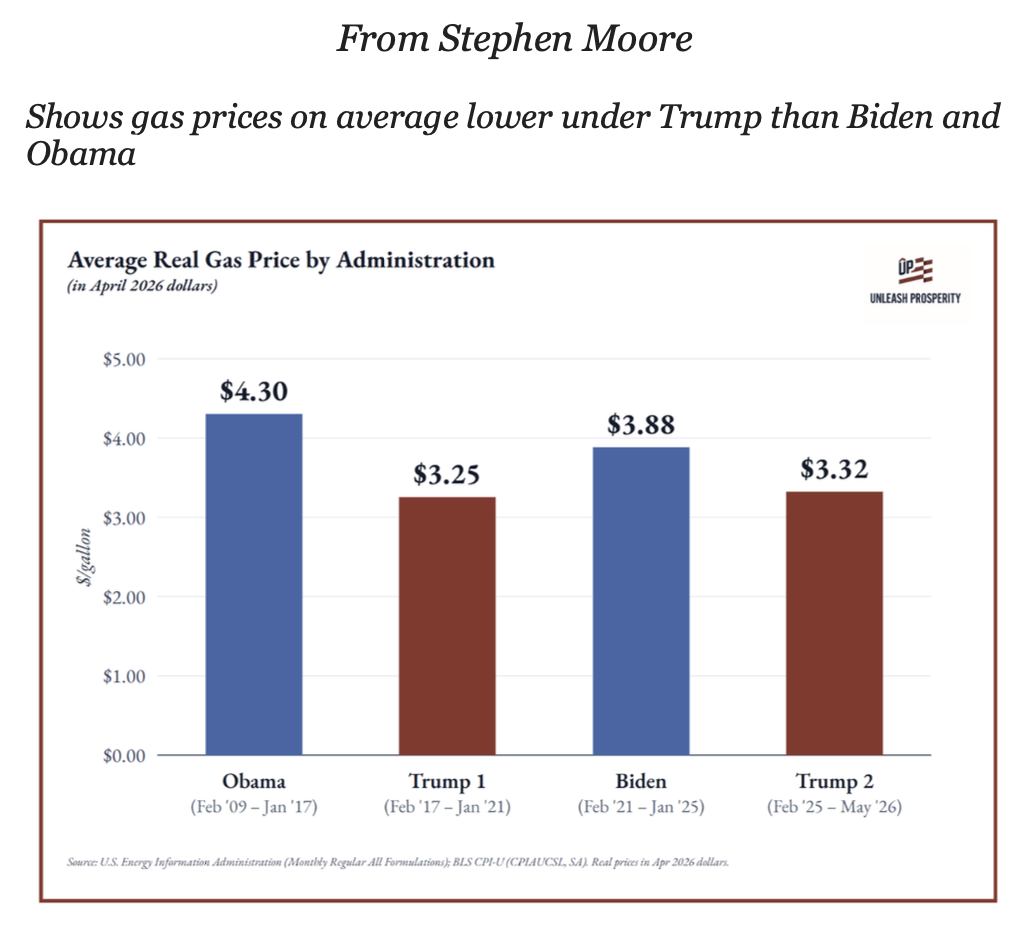
Trump touts Stephen Moore chart showing gas prices lower under both his terms
Trump the graphic from Unleash Prosperity pegs the real average pump price at $3.25 during Trump's first term and $3.32 during his second, against $4.30 under Obama and $3.88 under Biden.

WASHINGTON D.C. — Donald Trump shared a chart claiming average gas prices ran lower under his two terms than under Barack Obama or Joe Biden.
Here is the full post on truthsocial: “From Stephen Moore Shows gas prices on average lower under Trump than Biden and Obama $/gallon Average Real Gas Price by Administration (in April 2026 dollars) $5.00 $4.30 $4.00 $3.00 $2.00 $1.00 $3.88 $3.25 $3.32 $0.00 Obama (Feb ’09-Jan ’17) Trump 1 (Feb ’17 – Jan ’21) Biden (Feb ’21 – Jan ’25) Trump 2 (Feb ’25 – May ’26) Source: U.S. Energy Information Administration (Monthly Regular All Formulations); BLS CPI-U (CPLAUCSL, SA). Real prices in Apr 2026 dollars.”
The bar chart carries the label of Unleash Prosperity, the pro-growth advocacy group co-founded by Stephen Moore, a conservative economist and former senior economic adviser to Trump. It shows an inflation-adjusted average of $4.30 per gallon under Obama, $3.25 during Trump’s first term, $3.88 under Biden and $3.32 during Trump’s second term through May 2026. The figures are stated in April 2026 dollars and credit the U.S. Energy Information Administration for the underlying price data and the Bureau of Labor Statistics for the inflation series.
The chart adjusts nominal pump prices for inflation, a step that raises earlier prices when measured in current dollars. That method narrows the gap between administrations that governed years apart. The Trump 2 bar ends in May 2026, a partial term rather than a full four years.
Moore has kept up a steady media presence on economic policy. He co-founded Unleash Prosperity and appears on Fox Business programs to discuss taxes, spending and housing, according to foxbusiness.com. On “The Bottom Line” he criticized a housing affordability bill and pushed a capital gains tax cut, according to foxbusiness.com. On “Kudlow” he debated Democratic proposals to raise taxes on high earners, according to foxbusiness.com.

Gas prices touch nearly every US household budget, from commuters to shippers who pass fuel costs into grocery and delivery prices. A swing of a dollar per gallon changes the annual fuel bill for a typical two-car family by hundreds of dollars. That direct impact makes pump prices one of the most closely watched economic gauges heading into any election cycle.
Has a president leaned on gas price comparisons before? This has happened before. Presidents of both parties have highlighted or been blamed for pump prices, even though a chief executive controls little of the global oil market that sets them. Prices swing with OPEC output decisions, refinery capacity and demand shocks such as the 2020 pandemic collapse and the 2022 spike tied to war in Ukraine.
No agency or regulator is scheduled to rule on the claim, since it is a political argument rather than a formal filing. The next monthly retail gasoline figures from the U.S. Energy Information Administration will provide fresh data, though a specific decision date on the underlying dispute has not been announced.
Presidents have long tried to bend the politics of the pump, as happened before. In 1973, an Arab oil embargo sent US gasoline lines snaking around blocks and pushed prices sharply higher during Richard Nixon’s presidency, according to britannica.com. Jimmy Carter faced a second oil shock in 1979 that fed inflation and long station lines, and he lost his 1980 reelection bid to Ronald Reagan, according to britannica.com. The lesson has endured for every occupant of the Oval Office who has tried to claim credit, or dodge blame, for the number on the sign.
NewsFindr Chart Maker
Zenger analysis

OpenTopoMap / Natural Earth – Ukraine